
Review ratings
Integration support
Free
Ideal for
Price
Free
Gallery

About
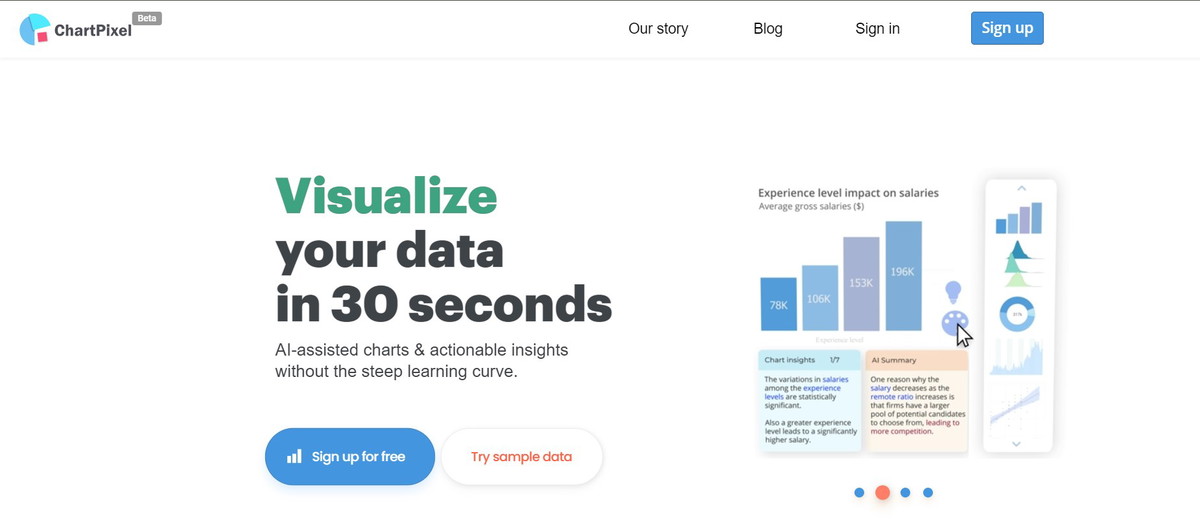
ChartPixel sets itself apart with its AI-enhanced data analysis and visualization features. It's not merely about producing graphs; it focuses on delivering actionable insights supported by statistical evidence. Its user-friendly design eliminates the common steep learning curve linked to data analysis software.
Instant Data Visualization: Convert your data into visually engaging interactive charts and insights.
Data Cleaning and Feature Engineering: Cleans up disorganized data in your uploaded spreadsheets (Excel, CSV, and Google Sheets) and also generates new, valuable features.
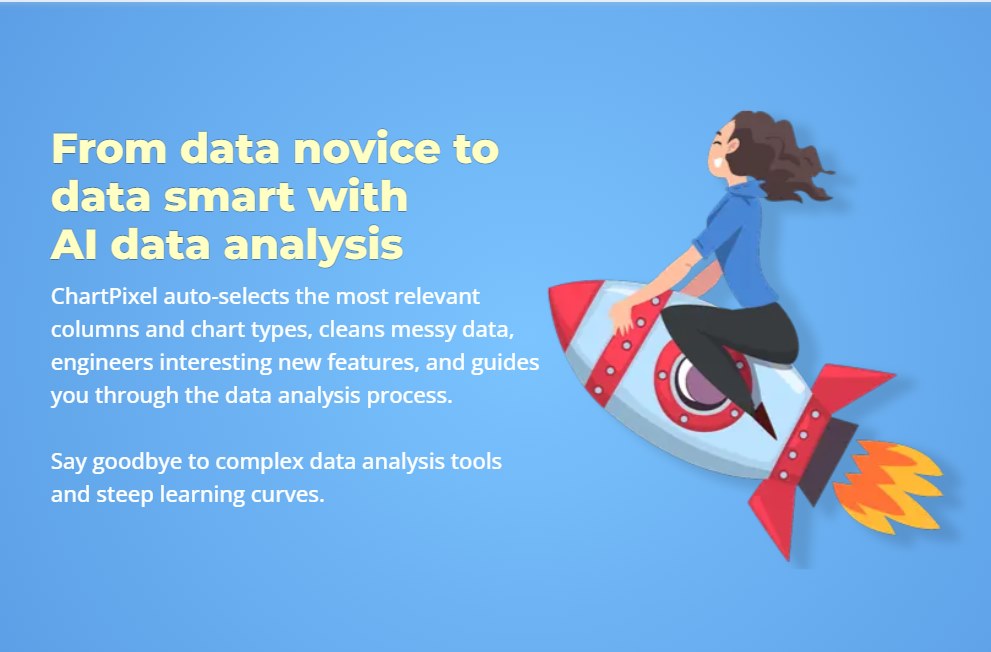
AI and statistics-driven data insights: Automatically identifies relevant columns and chart types complemented by AI-driven explanatory insights.
Diverse chart options: Provides over twenty distinct chart types along with explanatory insights.
One-click sharing & export: Transforms data insights into PowerPoint presentations, merging visual appeal with statistical precision. Upcoming features will include dashboard publishing and exporting to Word & Excel.